13/08/2026
A utility-scale data center may appear as one load at the point of interconnection, but electrically it is a small power system behind the meter: transformers, UPS rectifiers, DC links, batteries, inverters, server power supplies, VFD-driven cooling, protection and control. A credible grid model has to preserve the parts of that behavior that matter during a disturbance.
The industry is moving away from the idea that a hyperscale or AI data center can be represented as a single constant-MW load. That simplification may be acceptable for an early screening case, but it becomes weak once the study asks a dynamic question: what happens during a voltage sag, a frequency excursion, a fast load change, a UPS transfer, or the first few seconds after fault clearance?
This shift is now visible in both reliability guidance and interconnection requirements. NERC has identified computational loads as a major reliability consideration because of their scale and disturbance-sensitive behavior, and its Load Modeling Working Group endorsed the PERC1 performance model for data-center representation while continuing work on more advanced formulations. [5][6]
In ERCOT, NOGRR282 was approved on July 9, 2026 and became effective August 1, 2026, establishing voltage and frequency ride-through requirements for Large Computational Loads (LCLs). ERCOT's PGRR144 is still a pending revision request at the time of writing; it proposes a more formal dynamic-model submission and review framework using PSS/E, PSCAD and, where applicable, TSAT, together with site-specific Model Quality Testing and converter validation. [1][2][3]
The first modelling decision is not the software. It is deciding what the load actually is. At the POI, the grid sees the combined response of the IT equipment and the electrical and mechanical systems that keep it alive. A useful first-order balance is:
P_POI = P_IT + P_cooling + P_auxiliary + P_losses ± P_storage
Those terms do not respond in the same way. Cooling can include chillers, pumps, fans and VFDs with motor inertia, contactors and protective functions. The computational path is dominated by power electronics: rectifiers and UPS systems feeding DC links and downstream server power supplies. A UPS can continue supporting the IT load while its rectifier input is disturbed, then draw additional power after recovery to restore the internal energy buffer. That post-fault recharge can be as important to the grid as the initial voltage dip.
This is why the model should be built around functional groups rather than around one nameplate MW value. NERC's large-load work has repeatedly emphasized that peak demand alone does not describe the reliability behavior of emerging loads; ramping, voltage sensitivity, protection and recovery characteristics matter as well. [6]
PSS/E and PSCAD should not be treated as competing versions of the same model. They work at different levels of abstraction and are strongest when used together.

The important engineering requirement is consistency at the electrical boundary. The internal representation can be different, but the models should tell the same story at the POI: the same initial P and Q, the same voltage-sensitive reduction, compatible ride-through thresholds, realistic current limits, comparable recovery timing, and protection logic that reflects the actual facility. A detailed EMT model is not useful if the planning model assumes a completely different plant.
ERCOT's proposed PGRR144 makes this cross-platform consistency explicit by calling for dynamic data compatible with PSS/E, PSCAD and TSAT, and for model checkpoints through the interconnection process, including updated as-built information before energization. [2]
A practical PSS/E representation separates the motor-rich cooling and auxiliary system from the power-electronic computational load. For the first branch, CMLD/CMLDBLU2 is useful because it can represent a distribution transformer and feeder together with multiple motor classes, static/electronic fractions, undervoltage protection and recovery behavior. This is a much better starting point for cooling than a single constant-power record.
CMLD should still be parameterized from the actual cooling architecture. A modern data center may use large VFD-driven chillers, pumps and fans, and not every VFD behaves like a conventional induction motor. The aggregate motor fractions, voltage protection, contactor behavior and reconnection assumptions therefore need to come from equipment data, design information or a justified sensitivity range rather than from generic defaults.
For the IT/UPS branch, PERC1 provides a performance-based way to represent the aggregate response of the power-electronic load in transient-stability studies. NERC's Load Modeling Working Group endorsed PERC1 in December 2025, and NERC's 2026 work program describes it as the industry model for data-center performance while more advanced PERC2 functionality is being developed. [5][6]
The core idea is more important than the model name: the computational branch needs explicit logic for voltage-dependent power reduction or cessation, reconnection conditions, recovery delay, recovery ramp, current limits and frequency behavior. A simple electronic fraction inside CMLD cannot reproduce all of these states. NERC's April 2026 LMWG agenda even included a dedicated discussion on the inadequacy of the CMLD power-electronic component for the complex disturbance response of emerging computational loads. [7]
Technical note on the reviewed model files. The supplied PSS/E packages use CMLDBLU2 for the cooling/auxiliary branch and a PERCBL/PERC2 user-defined model for the computational branch. Because PERC1 is the publicly endorsed NERC baseline while PERC2 remains an evolving industry formulation, this article uses the broader term “PERC-family model” when discussing the architecture and does not publish project-specific parameter values.
This split is also useful operationally. Cooling and IT load can be tuned independently, and the study can test whether the apparent facility response is being driven by motor behavior, converter logic or protection. It also makes later model validation much easier because changes in one subsystem do not have to be hidden inside one aggregate block.

Figure 1. Representative anonymized PSS/E RMS voltage response during a composite ride-through sequence. The traces represent the POI and internal high-/medium-voltage buses. Project and bus identifiers have been removed.

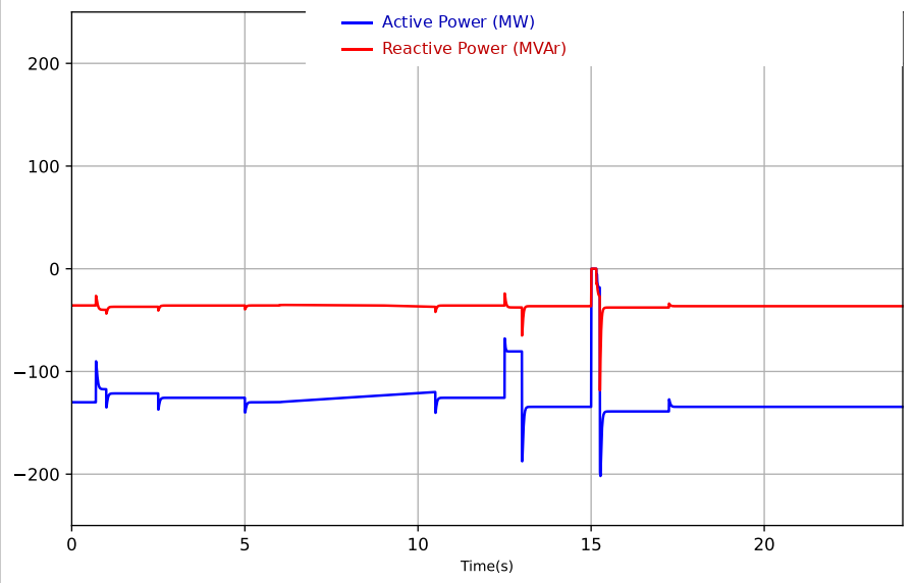
Figure 2. Representative anonymized PSS/E RMS active- and reactive-power response at the POI during the composite ride-through sequence. The source study uses the network load-flow sign convention, so imported active and reactive power appear negative. Project and bus identifiers have been removed.
The PSCAD model needs a different level of detail. The reviewed source models follow the same physical structure used in the Pacific Northwest National Laboratory Data Center Model Library: a three-phase double-conversion UPS with an AC/DC rectifier, DC link, battery/DC-DC path, DC/AC inverter and computational load, with cooling represented as a parallel facility load. PNNL explicitly describes its DML as a library of generic EMT components for grid-level data-center studies and warns that site-specific data and engineering judgment are required before a generic model can represent a real facility. [4]
That warning is important. In EMT studies, a few milliseconds of control or protection delay can change the result. The model should therefore reflect the real UPS topology, rectifier current limits, DC-link energy, internal battery behavior, bypass logic, inverter limits, frequency and voltage protection, cooling controls and any plant-level BESS or supervisory controller that materially changes the POI response.
One behavior that is easy to miss in an RMS-only model is the sequence during and after a severe voltage sag. The rectifier may temporarily lose the ability to supply the DC link, while the internal UPS battery keeps the computing load energized. Once AC input is restored, the rectifier must serve the ongoing IT demand and replenish internal stored energy. The result can be a post-fault demand pickup or overshoot. If the PSCAD model shows this behavior while the PSS/E model reconnects instantaneously to its pre-fault MW, the two models are not yet equivalent.
PSCAD is also the natural platform for converter-model validation and subsynchronous assessment. ERCOT's March 2026 draft MQT/CMV guidance describes converter validation as a hardware-type test for the UPS converter and associated computational load, including voltage ride-through and a subsynchronous frequency scan. The guidance illustrates a 5-55 Hz scan in 1 Hz increments for the converter impedance test. [3]

Figure 3. Representative PSCAD EMT POI voltage during a composite voltage ride-through sequence. The test traverses shallow undervoltage, deep undervoltage, severe low-voltage and overvoltage regions.

Figure 4. Representative PSCAD EMT active- and reactive-power response at the POI for the same composite disturbance. The important result is not a perfectly flat MW trace; it is controlled reduction, ride-through and recovery without unexplained tripping or sustained instability.
It helps to separate three questions that are often mixed together. First, does the model initialize and behave numerically? Second, does the whole facility model meet the expected ride-through behavior? Third, does the converter model actually reproduce the hardware?

ERCOT's March 2026 guidance describes the Model Quality Test as a site-specific whole-facility test and CMV as a converter/hardware-type validation. That distinction is technically sound. A facility can have a well-validated UPS converter model and still have a poor site model because the wrong cooling share, protection settings or transformer data were used. The reverse is also possible: a site model can pass a simplified MQT while the underlying EMT converter block is not well benchmarked against hardware.
For current ERCOT work, the regulatory status also matters. NOGRR282 ride-through requirements are now approved and effective. PGRR144, including the detailed dynamic-model submission and validation framework, remains pending as of this article's date. It should therefore be cited as an evolving requirement rather than as a final rule.
Cross-platform validation is not a point-by-point waveform comparison. PSS/E is a phasor-domain RMS tool and PSCAD is an EMT tool, so some fast transients should look different. The engineering test is whether both models preserve the same facility behavior at the time scale each model is intended to represent.

The last point is especially important for as-built validation. UPS firmware, protection settings, cooling controls and operating modes can change between the interconnection study and commissioning. A model that was correct at design stage can become wrong without a single change to the facility's MW rating. PGRR144 specifically addresses material changes in technology or controls that may alter ride-through behavior and proposes updated as-built models before energization.
The most useful way to think about a data-center model is as a hierarchy. The planning model should be simple enough to run across thousands of system contingencies, but detailed enough to reproduce the facility's real dynamic behavior. The EMT model should go deeper into the converter and protection physics, but it still has to be parameterized from actual equipment and operating logic.
For PSS/E, a CMLD + PERC architecture is a strong engineering approach because it separates cooling/auxiliary dynamics from computational power-electronic behavior. For PSCAD, a physically structured UPS model - rectifier, DC link, internal battery, inverter and controls - gives the fidelity needed to study severe disturbances, recovery, converter interactions and validation.
The real objective is not to make the PSS/E and PSCAD files look complicated. It is to make them trustworthy. If the grid model can explain why the data center reduces power, what stays energized, when it reconnects, how fast it recovers and how those answers change with voltage, frequency and protection settings, then the model is doing useful engineering work.
The model should not only reproduce the megawatts before the event. It should reproduce the story of the megawatts during and after the event.
Public references below are intentionally separated from the anonymized engineering figures used in this article. Private project names and client identifiers are not included.
[1] ERCOT, NOGRR282 - Board Priority: Large Computational Load Ride-Through Requirements. Approved July 9, 2026; effective August 1, 2026. Official source
[2] ERCOT, PGRR144 - Dynamic Model Submission and Review Requirements for Large Loads including Large Computational Loads. Revision request posted February 18, 2026; pending at the time of writing. Official source
[3] ERCOT, Guideline for Model Quality Test in PGRR144 - DWG Procedure Manual Updates, Large Load Working Group, March 13, 2026. Official source
[4] B. A. Ross and J. D. Follum, Electromagnetic Transient Modeling of Large Data Centers for Grid-Level Studies, Pacific Northwest National Laboratory, PNNL-38817, January 2026. Official source
[5] NERC, Large Loads Action Plan Q4 2025 Update, January 2026. Notes LMWG endorsement of the PERC1 model for data-center performance. Official source
[6] NERC, 2026 State of Reliability - Overview, June 2026. Discusses computational-load events, model needs and continued PERC1 development. Official source
[7] NERC Load Modeling Working Group, Meeting Agenda, April 14-15, 2026. Includes PERC1 application, PERC2 functional development, physics-based data-center models, and CMLD limitations for computational loads. Official source
[8] NERC, Data Center Load Modeling Technical Reference Document, Load Modeling Working Group, published August 3, 2026 (listed on NERC Technical Reference Documents page). Official source
Figure source note: Figures 1-4 are representative, anonymized outputs extracted from large data-center engineering model packages reviewed for this article. Figures 1 and 2 are paired PSS/E RMS results from the same composite ride-through study; Figures 3 and 4 are PSCAD EMT results. Project names, bus identifiers and client-specific references have been removed. The figures are illustrative engineering results, not generic compliance benchmarks.